|
|
|
|
|
|
| Read more ...... |
 |
OverviewMetaboAnalyst is a web-based platform dedicated for comprehensive metabolomics data analysis, interpretation and integration with other omics data. Over the past decade, MetaboAnalyst has evolved from statistical and functional analysis for targeted metabolomics data, towards more streamlined analysis for both quantitative and untargeted metabolomics data. In addition to many feature enhancements, the version 6.0 contains three new modules - tandem MS spectral processing and compound annotation, dose response analysis for chemical risk assessment, and leveraging metabolite-genome wide association analysis and Mendelian randomization for causal analysis. |
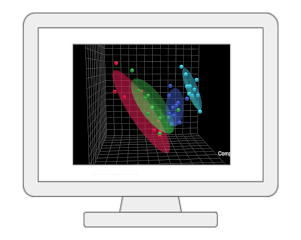 |
Statistical Analysis [single factor]The module provides a wide array of commonly used statistical and machine learning methods: traditional univariate methods - fold change, t-test, volcano plot, ANOVA, correlation analysis; or more advanced methods designed for significance analysis of high-dimensional data, and empirical Bayesian analysis; multivariate statistics - principal component analysis (PCA), partial least squares-discriminant analysis (PLS-DA) or orthogonal partial least squares-discriminant analysis (OPLS-DA); clustering - dendrogram, heatmap, K-means, and self organizing map (SOM); as well as supervised classification - random forests and support vector machine (SVM). |
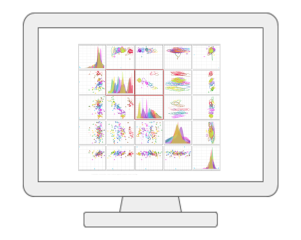 |
Statistical Analysis [metadata table]MetaboAnalyst now allows users to visualize and compute associations between phenotypes and metabolomics features with considerations of other experimental factors / covariates. It employs general linear models to accommodate modern epidemiological study, together with PCA and heatmaps for visual explorations. For two-factors / time-series data, users have more options including two-way ANOVA, multivariate empirical Bayes time-series analysis (MEBA), and ANOVA-simultaneous component analysis (ASCA). |
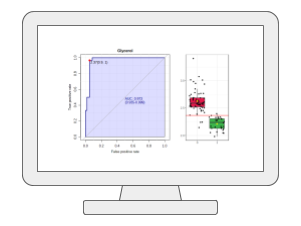 |
Biomarker AnalysisMetaboAnalyst provides the receiver operating characteristic (ROC) curve based approach for identifying potential biomarkers and evaluating their performance. It offers classical univariate ROC curve analysis as well as more modern multivariate ROC curve analysis based on PLS-DA, SVM or Random Forests. In addition, users can manually select biomarkers or set up hold-out samples for flexible evaluation and validation. |
 |
Pathway AnalysisMetaboAnalyst currently supports metabolic pathway analysis (integrating pathway enrichment analysis and pathway topology analysis) and visual exploration for > 120 species. In addition, users can also perform joint pathway analysis by uploading both gene list together with the metabolite/peak list for ~25 common model organisms. |
 |
Enrichment AnalysisMetaboAnalyst performs metabolite set enrichment analysis (MSEA) contains human and mammalian metabolite sets, as well as chemical class metabolite sets. This module accepts a list of compound names, a list of compound names with concentrations, or a concentration table. The analysis is based on 15 libraries containing ~13,000 biologically meaningful metabolite sets collected primarily from human studies including >1500 chemical classes. |
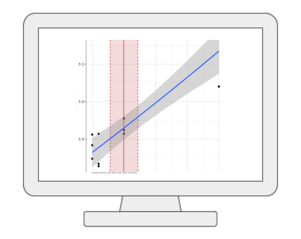 |
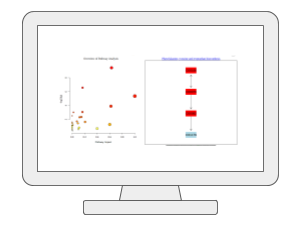
Dose Response AnalysisMetaboAnalyst offers comprehensive support for dose response analysis between individual omics feature (i.e. metabolites or peaks) and exposures. It currently supports 10 curve fitting methods (for repeated dosing) and 17 curve fitting methods (for continuous exposures). The best models will be used to derive benchmark dose (BMD) for risk assessment. |
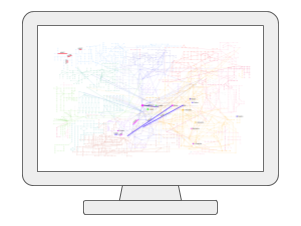 |
Network AnalysisUsers can upload one or two lists of metabolites, genes, or KEGG orthologs (i.e. generated from metagenomics), and then visually explore these molecules of interest within the context of biological networks such as the KEGG global metabolic network, as well as several networks created based on known associations between genes, metabolites, and diseases. |
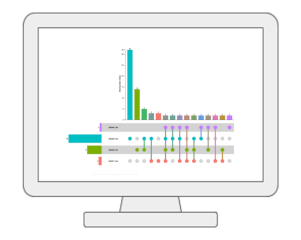 |
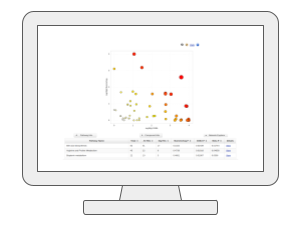
Statistical Meta-analysisUsers can upload several annotated metabolomics data sets collected under comparable conditions to identify robust biomarkers (compounds or annotated peaks) across multiple studies. It currently supports several meta-analysis methods based on p-value combination, vote counts and direct merging. The results can be explored in an interactive Upset diagram. |
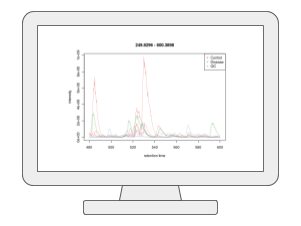 |
LC-MS Spectral ProcessingUsers can now upload their LC-MS spectra (in centroid mode and open formats such as mzML, mzXML and mzData) and perform peak picking, peak alignment and peak annotation using the auto-optimized workflow based on our MetaboAnalystR 4.0. The current V6.0 also supports the latest asari algorithm. In addition to LC-MS1 spectra, users can also include the associated MS2 spectra for peak annotation. Both DDA or SWATH-DIA are supported. |
 |
MS/MS peak annotationThis new module performs MS2 peak annotation based on a comprehensive list of public MS2 databases. Users can either directly enter a two-column peak list containing m/z and intensity values (DDA); For SWATH-DIA MS2 spectra, users can upload a .msp file produced by MetaboAnalystR 4.0, MZmine, or MS-DIAL after the spectral deconvolution step. A maximum of 50 tandem MS spectra can be uploaded to the public server. |
 |
Functional Analysis [MS Peaks to Pathways]This module supports functional analysis of untargeted metabolomics data generated from high-resolution mass spectrometry (HR-MS) such as Orbitrap or TOF. The basic assumption is that approximate annotation at individual compound level can accurately point out functional activity at pathway level based on their non-random, collective behaviors. The module supports the mummichog or GSEA algorithms. It now supports > 120 species based on user feedback. |
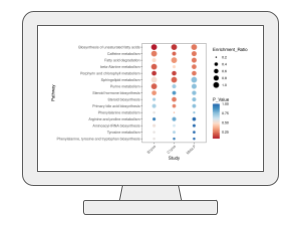 |
Functional Meta-analysis of MS PeaksWith MetaboAnalyst, users can now perform meta-analysis of untargeted metabolomics data. Our method extends the MS Peaks to Paths workflow to reduce the bias individual studies may carry towards specific sample processing protocols or LC-MS instruments. The current workflow allows users to perform meta-analysis of MS peaks to help identify consistent functional signatures by integrating functional profiles from independent studies or by pooling peaks from complementary instruments. |
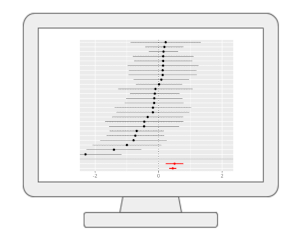 |
Causal Analysis via mGWASMetabolomics-based genome-wide association studies (mGWAS) are key to understanding the genetic regulations of metabolites in complex phenotype. By leveraging those SNP-tagged metabolites and summary statistics from public GWAS repositories, we can now test potential causal relationships between those genetically influenced metabolites and a disease outcome of interest using the well-established two-sample Mendelian randomization method. |
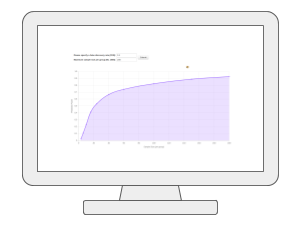 |
Power AnalysisUsers can upload a dataset either from a pilot study or from a similar study to compute the minimum number of samples required to detect the effect within a certain degree of confidence, as well as to estimate the power of the current study design. |
|
|
Training & Pro ServicesAccess self-paced Omics Data Science training coupled with AI, tools and our Omics Data Science book. For organizations requiring enhanced capabilities, our Pro version runs on cloud or on your server with dedicated support and custom integrations. |